| INTERNET USAGE STATISTICS FOR AFRICA | ||||||
| AFRICA | Population (2011 Est.) |
Internet Users Dec/2000 |
Internet Users Latest Data |
Penetration (% Population) |
User Growth (2000-2011) |
% Users in Africa |
|---|---|---|---|---|---|---|
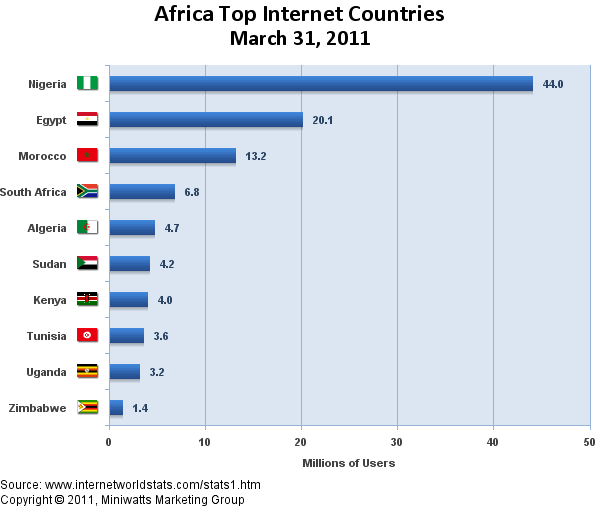
| Algeria | 34,994,937 | 50,000 | 4,700,000 | 13.4 % | 9,300.0 % | 4.0 % |
| Angola | 13,338,541 | 30,000 | 607,400 | 4.6 % | 1,924.7 % | 0.5 % |
| Benin | 9,325,032 | 15,000 | 200,000 | 2.1 % | 1,233.3 % | 0.2 % |
| Botswana | 2,065,398 | 15,000 | 120,000 | 5.8 % | 700.0 % | 0.1 % |
| Burkina Faso | 16,751,455 | 10,000 | 178,200 | 1.1 % | 1,682.0 % | 0.2 % |
| Burundi | 10,216,190 | 3,000 | 157,800 | 1.5 % | 5,160.0 % | 0.1 % |
| Cameroon | 19,711,291 | 20,000 | 750,000 | 3.8 % | 3,650.0 % | 0.6 % |
| Cape Verde | 516,100 | 8,000 | 150,000 | 29.1 % | 1,775.0 % | 0.1 % |
| Central African Rep. | 4,950,027 | 1,500 | 66,500 | 1.3 % | 4,333.3 % | 0.1 % |
| Chad | 10,758,945 | 1,000 | 187,800 | 1.7 % | 18,680.0 % | 0.2 % |
| Comoros | 794,683 | 1,500 | 24,300 | 3.1 % | 1,520.0 % | 0.0 % |
| Congo | 4,243,929 | 500 | 245,200 | 5.8 % | 48,940.0 % | 0.2 % |
| Congo, Dem. Rep. | 71,712,867 | 500 | 503,040 | 0.7 % | 100,508.0 % | 0.4 % |
| Cote d’Ivoire | 21,504,162 | 40,000 | 968,000 | 4.5 % | 2,320.0 % | 0.8 % |
| Djibouti | 757,074 | 1,400 | 52,660 | 7.0 % | 3,661.4 % | 0.0 % |
| Egypt | 82,079,636 | 450,000 | 20,136,000 | 24.5 % | 4,374.7 % | 17.0 % |
| Equatorial Guinea | 668,225 | 500 | 14,400 | 2.2 % | 2,780.0 % | 0.0 % |
| Eritrea | 5,939,484 | 5,000 | 250,000 | 4.2 % | 4,900.0 % | 0.2 % |
| Ethiopia | 90,873,739 | 10,000 | 445,400 | 0.5 % | 4,354.0 % | 0.4 % |
| Gabon | 1,576,665 | 15,000 | 98,800 | 6.3 % | 558.7 % | 0.1 % |
| Gambia | 1,797,860 | 4,000 | 130,100 | 7.2 % | 3,152.5 % | 0.1 % |
| Ghana | 24,791,073 | 30,000 | 1,297,000 | 5.2 % | 4,223.3 % | 1.1 % |
| Guinea | 10,601,009 | 8,000 | 95,000 | 0.9 % | 1,087.5 % | 0.1 % |
| Guinea-Bissau | 1,596,677 | 1,500 | 37,100 | 2.3 % | 2,373.3 % | 0.0 % |
| Kenya | 41,070,934 | 200,000 | 3,995,500 | 9.7 % | 1,897.8 % | 3.4 % |
| Lesotho | 1,924,886 | 4,000 | 76,800 | 4.0 % | 1,820.0 % | 0.1 % |
| Liberia | 3,786,764 | 500 | 20,000 | 0.5 % | 3,900.0 % | 0.0 % |
| Libya | 6,597,960 | 10,000 | 353,900 | 5.4 % | 3,439.0 % | 0.3 % |
| Madagascar | 21,926,221 | 30,000 | 320,000 | 1.5 % | 966.7 % | 0.3 % |
| Malawi | 15,879,252 | 15,000 | 716,400 | 4.5 % | 4,676.0 % | 0.6 % |
| Mali | 14,159,904 | 18,800 | 250,000 | 1.8 % | 1,229.8 % | 0.2 % |
| Mauritania | 3,281,634 | 5,000 | 75,000 | 2.3 % | 1,400.0 % | 0.1 % |
| Mauritius | 1,303,717 | 87,000 | 290,000 | 22.2 % | 233.3 % | 0.2 % |
| Mayotte (FR) | 209,530 | n/a | 10,620 | 5.1 % | n/a | 0.0 % |
| Morocco | 31,968,361 | 100,000 | 13,213,000 | 41.3 % | 13,113.0 % | 11.1 % |
| Mozambique | 22,948,858 | 30,000 | 612,500 | 2.7 % | 1,941.7 % | 0.5 % |
| Namibia | 2,147,585 | 30,000 | 127,500 | 5.9 % | 325.0 % | 0.1 % |
| Niger | 16,468,886 | 5,000 | 115,900 | 0.7 % | 2,218.0 % | 0.1 % |
| Nigeria | 155,215,573 | 200,000 | 43,982,200 | 28.3 % | 21,891.1 % | 37.1 % |
| Reunion (FR) | 834,261 | 130,000 | 300,000 | 36.0 % | 130.8 % | 0.3 % |
| Rwanda | 11,370,425 | 5,000 | 450,000 | 4.0 % | 8,900.0 % | 0.4 % |
| Saint Helena (UK) | 7,700 | n/a | 900 | 11.7 % | n/a | 0.0 % |
| Sao Tome & Principe | 179,506 | 6,500 | 26,700 | 14.9 % | 310.8 % | 0.0 % |
| Senegal | 12,643,799 | 40,000 | 923,000 | 7.3 % | 2,207.5 % | 0.8 % |
| Seychelles | 89,188 | 6,000 | 33,900 | 38.0 % | 465.0 % | 0.0 % |
| Sierra Leone | 5,363,669 | 5,000 | 34,100 | 0.6 % | 582.0 % | 0.0 % |
| Somalia | 9,925,640 | 200 | 106,000 | 1.1 % | 52,900.0 % | 0.1 % |
| South Africa | 49,004,031 | 2,400,000 | 6,800,000 | 13.9 % | 183.3 % | 5.7 % |
| Sudan | 45,047,502 | 30,000 | 4,200,000 | 9.3 % | 13,900.0 % | 3.5 % |
| Swaziland | 1,370,424 | 10,000 | 90,000 | 6.6 % | 800.0 % | 0.1 % |
| Tanzania | 42,746,620 | 115,000 | 676,000 | 1.6 % | 487.8 % | 0.6 % |
| Togo | 6,771,993 | 100,000 | 356,300 | 5.3 % | 256.3 % | 0.3 % |
| Tunisia | 10,629,186 | 100,000 | 3,600,000 | 33.9 % | 3,500.0 % | 3.0 % |
| Uganda | 34,612,250 | 40,000 | 3,200,000 | 9.2 % | 7,900.0 % | 2.7 % |
| Western Sahara | 507,160 | n/a | n/a | n/a | 0.0 % | 0.0 % |
| Zambia | 13,881,336 | 20,000 | 816,700 | 5.9 % | 3,983.5 % | 0.7 % |
| Zimbabwe | 12,084,304 | 50,000 | 1,422,000 | 11.8 % | 2,744.0 % | 1.2 % |
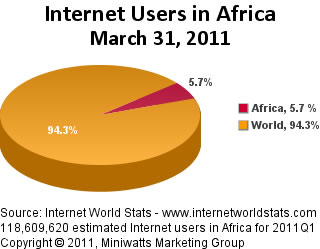
| TOTAL AFRICA | 1,037,524,058 | 4,514,400 | 118,609,620 | 11.4 % | 2,527.4 % | 100.0 % |
| NOTES: (1) Africa Internet Statistics were updated for March 31, 2011. (2) CLICK on each country name for further data on individual countries and regions. (3) Population numbers are based on data from the U.S. Census Bureau. (4) For help and definitions, see the site surfing guide. (5) Internet usage information comes mainly from data published by WWW, ITU , the Nielsen Company and other local trustworthy sources. (6) For growth comparison purposes, baseline usage data for the year 2000 is displayed. (7) Data from this table may be cited, giving the due credit and establishing an active link back to internetworldstats.com Copyright 2011, © Miniwatts Marketing Group. All rights reserved worldwide. | ||||||


